Project Patterns
Visualising the ebb and flow of a project
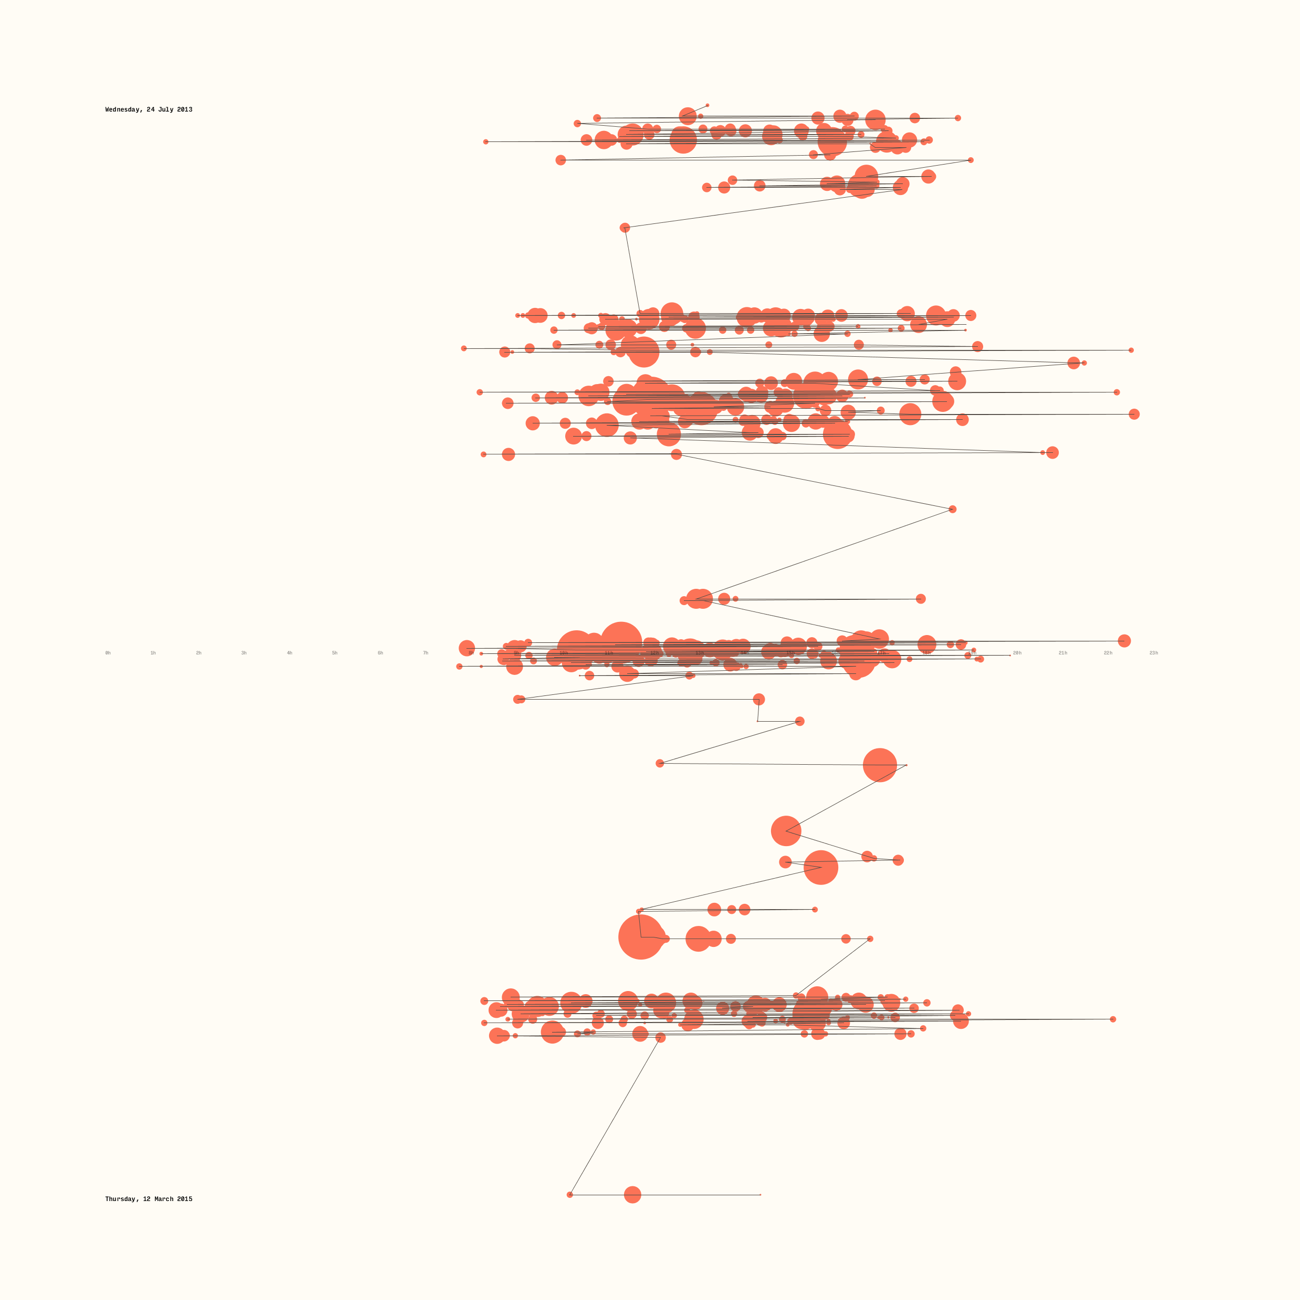
I've written before how using a Git repository for the code I write allows me the freedom to explore new paths within the work. There's also another benefit; the entire history of the project is then available for me to export and do something with. So I exported out my Git log for three projects and created a piece of software that would visualise the flow over time of how I worked.
Days travel vertically, whilst hours travel from left to right. The size of the circles indicates the size of the comment for that commit. I'm not concerned with indicating things like Git merges and the like. Rather this is an overview of the rhythm of a project in visual form.
You can see for Kennedy all the activity just before a major release, spread over the last three years. With Doris Le Bot I think you can see how I was trying out ideas, feeling my way into a project and then once happy with the idea I start to really dig into it. With The Invisible Infrastructure you can clearly see how I was sometimes working at 1 am after getting a call from the states to make some changes.


Created in 2015
Other “Dawesome” Things


Sign-up for the Dawesome Digest
Get in touch to talk about working together