Data as Object
Data you can hold in your hands
What if you could bump into data? What if you could hold data in your hands as easily as holding a cup?
These objects are created using the data from my Twitter archive. The teal coloured cubes illustrate my Twitter activity from 2008, 2010 and 2012. You can see that when I first joined Twitter I wasn't sure what it was, or how to use it. The 2008 cube is only slightly punctuated with activity. Jump ahead to 2012 and the change is stark - now there is lots of activity represented by the undulation of spikes across the surface of the cube.
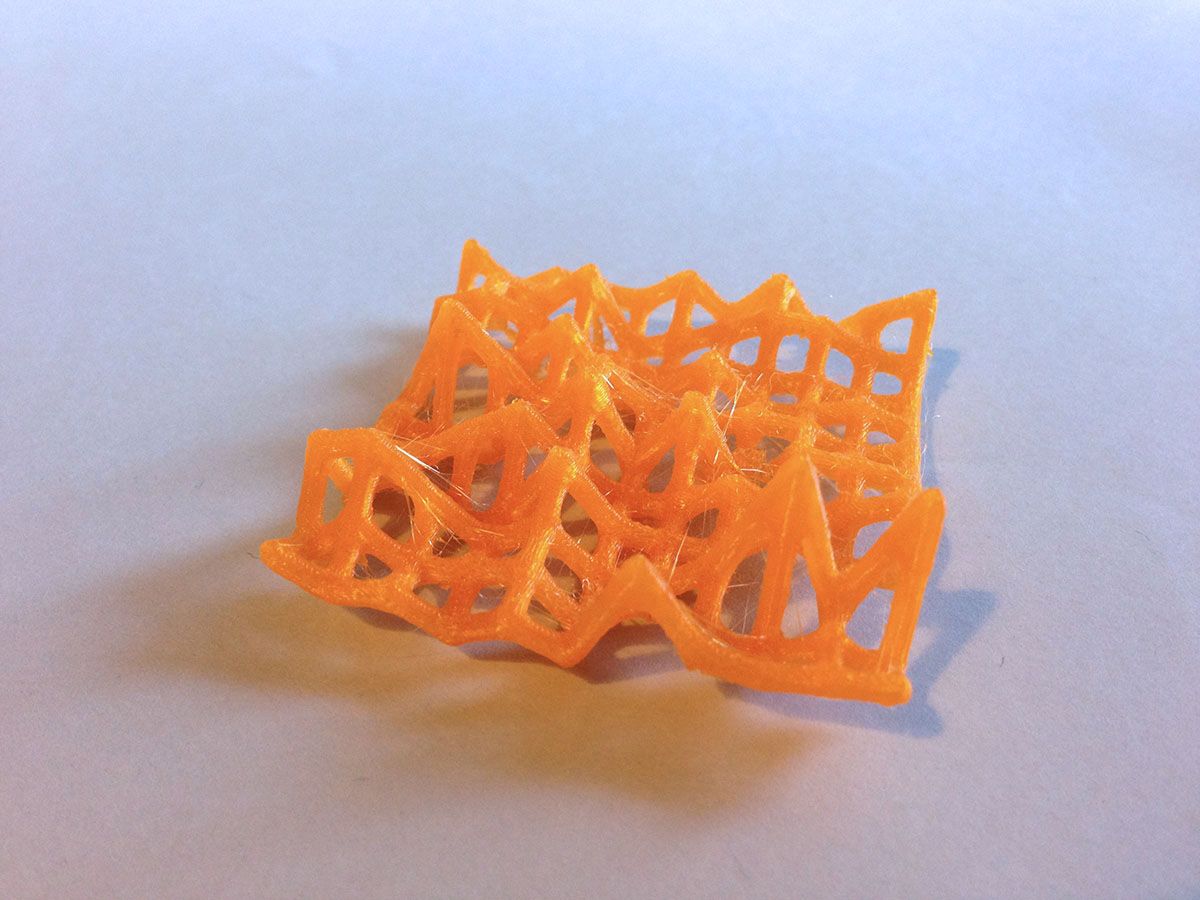
The orange grid like structures – or as I like to call them Data Waffles – show 2008 versus 2012. Again the difference between activity can not only be seen but also felt.
These are experiments; playful disruptions that try to explore how to make physical things from digital data. Have you bumped into any data today?


